
Claude agents now export OpenTelemetry traces
Anthropic launched OpenTelemetry (OTel) trace export on the Claude Platform as a public beta on October 14, 2026. Teams can follow an agent step by step in the same tool they use for the rest of their services.
Anthropic pitches tracing as the first move before giving an agent more access. The idea is to watch its model calls, tool use and MCP server calls first, and widen its permissions only once it proves reliable.
"You can now send OpenTelemetry (OTel) traces from Claude Managed Agents, the Messages API, and Claude SDKs to any OTel tool, and follow each step your agents take." / "Trusting an agent with more access starts with tracing its model calls, tool use, and MCP server calls. Review its traces, then widen its access as it proves reliable." — ClaudeView official source →
Managed Agents, the Messages API and the SDKs are covered
Traces come from three places: Claude Managed Agents, the Messages API and the Claude SDKs. For the first two, an admin adds a destination in the Claude Console and spans start flowing without touching application code. The SDKs for Python, TypeScript, C#, Go, Java, PHP and Ruby emit spans once you register a tracer provider in your app.
The two routes see different parts of a request. Setting up both puts the SDK span and the API span for one request in a single trace.
What SDK tracing and API tracing each show
| Shown in the trace | SDK tracing | API tracing |
|---|---|---|
| Messages API and Sessions API requests, token usage | Yes | Yes |
| Each model run within a request | No | Yes |
| Managed Agents turns | No | Yes |
| Server tools run by the API | No | Yes |
| Tools run by the tool runner or in a self-hosted sandbox | Yes | No |
| Who sets it up | Developer, in code | Admin, in the Console |
If you already send Claude Code or Cowork traces to an observability tool, agents built on the Claude Platform land in the same place. Claude Code, the Agent SDK and Cowork keep their own monitoring setup, documented separately.
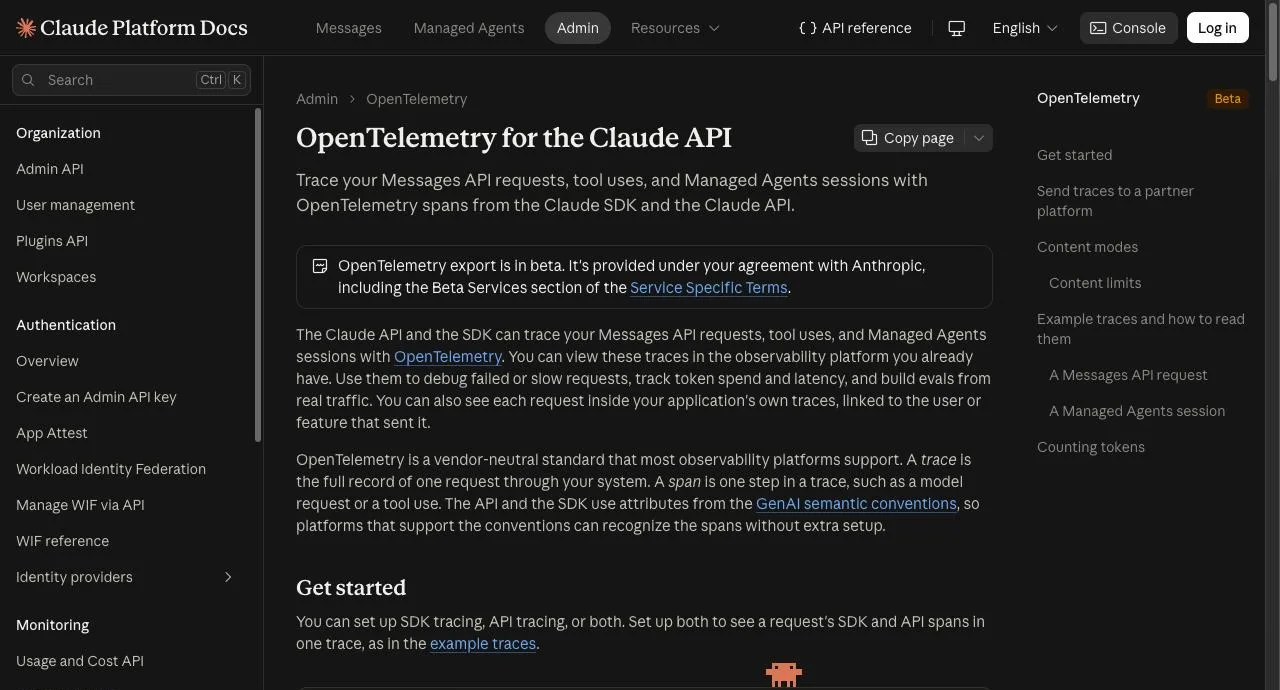
"OpenTelemetry is a vendor-neutral standard that most observability platforms support. A trace is the full record of one request through your system. A span is one step in a trace, such as a model request or a tool use." / "You can set up SDK tracing, API tracing, or both. Set up both to see a request's SDK and API spans in one trace" — Claude Platform DocsView official source →
Each trace records turns, model calls and tool use
Once a destination is in place, each agent turn, model call and tool use reaches your observability tool as a standard OpenTelemetry trace. Every span carries latency, token counts and IDs, which is enough to spot the slow step in a long agent run.
The attributes follow the OpenTelemetry GenAI semantic conventions. That means Claude data and data from other model providers can sit in the same tools and dashboards.
"Add a destination in the Claude Console, and every agent turn, model call, and tool use arrives in your observability tool as a standard OpenTelemetry trace, with latency, tokens, and IDs." / "Claude traces follow the OpenTelemetry GenAI semantic conventions, so data from Claude and other providers works in the same tools and dashboards." — ClaudeView official source →
Twelve observability partners can receive the traces
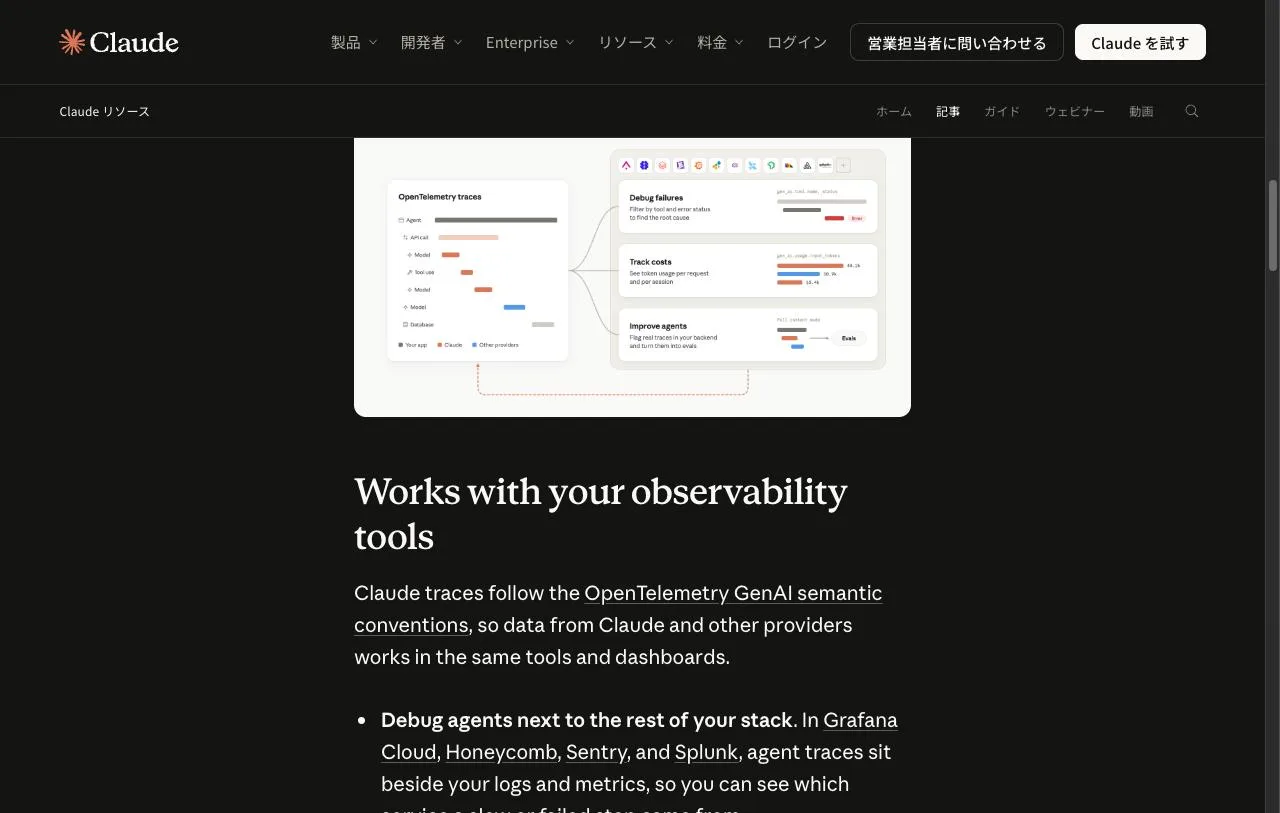
Anthropic names 12 partners that can take Claude traces, from Datadog to Langfuse. Any other tool works too, as long as it has an OTLP endpoint (the URL that receives OpenTelemetry data).
The announcement sorts the partners into three jobs. Langfuse is in the evals group, alongside Datadog and New Relic. We cover its license and pricing in Langfuse self hosted: license, pricing, OTel.
Partner tools by the job Anthropic lists them for
| Job | Partners |
|---|---|
| Debug next to logs and metrics, and find which service a slow or failed step came from | Grafana Cloud, Honeycomb, Sentry, Splunk |
| Turn real traces into evals, catch quality issues and check whether a change helped | Arize AI, Braintrust, Datadog, Langfuse, LangSmith, New Relic, PostHog |
| See token usage by team and flag unusual activity | Databricks (Unity Gateway) |
The third group is aimed at platform and security teams. Databricks Unity Gateway gives them token usage per team and a way to flag activity that looks off.
"Debug agents next to the rest of your stack. In Grafana Cloud, Honeycomb, Sentry, and Splunk, agent traces sit beside your logs and metrics, so you can see which service a slow or failed step came from." / "Improve agents with production data. With Arize AI, Braintrust, Datadog, Langfuse, LangSmith by LangChain, New Relic, and PostHog, you can turn real traces into evals, catch quality issues, and measure whether a change helped." / "Track usage across your organization. Send traces to Databricks Unity Gateway so platform and security teams can see token usage by team and flag unusual activity." — ClaudeView official source →
Customers use the traces for evals and audit trails
Anthropic's announcement quotes customers who use traces to improve agents and to answer auditors. Ankush Sharma, Head of Infrastructure at a company whose agents work on its books, puts each model call in the same Grafana Cloud trace as the reconciliation or journal-entry workflow around it. When an auditor asks what an agent did and why, the team answers from one timeline.
Foxglove, which builds agents that help robotics teams debug their robots, analyzes agent interactions in PostHog next to product usage data. Ramp runs Reflect, an internal system that scores Langfuse traces, finds recurring failures and proposes fixes.
Ramp's headline numbers come from Reflect, not from the new export. Senior Software Engineer David Traina says Reflect has already cut token usage by 10–20% on some agents and made sessions 30% faster. Native OTel export, he adds, can feed that loop directly with no extra steps.
"On some agents, we’ve already cut token usage by 10–20% and made sessions 30% faster. But Reflect can only improve what it observes." / "We see the prompt version, tool calls, latency, and token spend alongside the rest of our stack, so when an auditor asks what an agent did and why, we can answer from one timeline." — ClaudeView official source →
An admin turns it on with one Console destination
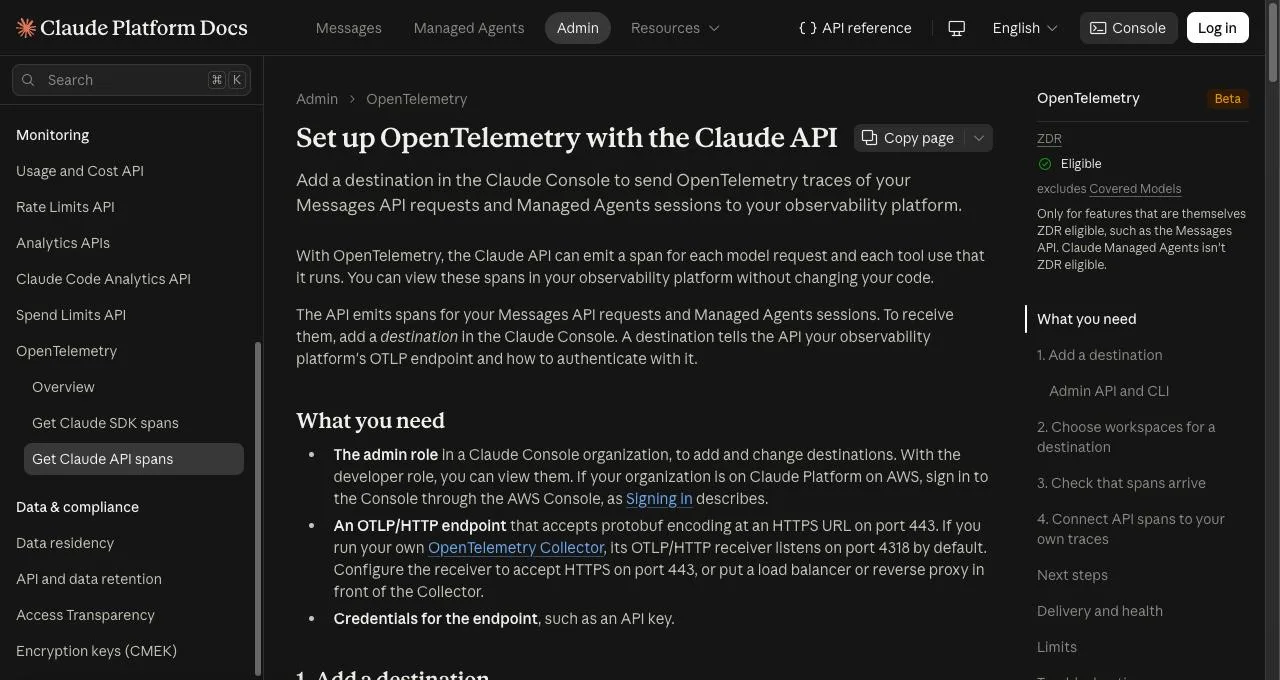
API spans start once an organization admin adds a destination in the Claude Console. Only the admin role can add or change destinations; developers can view them. Before you start, you need three things.
- The admin role in a Claude Console organization
- An OTLP/HTTP endpoint on your observability platform
- Credentials for that endpoint, such as an API key
The endpoint has to accept protobuf on port 443 over HTTPS. A self-hosted OpenTelemetry Collector listens on port 4318 out of the box. Either reconfigure it for 443 or put a load balancer or reverse proxy in front.
A destination takes these settings. If you pick a listed partner as the provider, the Console asks for that partner's details, such as an API key, instead of a raw endpoint.
- Provider (or Custom) and the endpoint URL
- Request headers that carry the credentials
- Content mode
- Workspaces: All, Selected or All except
After you save, click Test and wait for the Delivery column to read Healthy, which can take about a minute. In your tool, filter on service.name = claude-platform to find the spans.
Destinations can also be created through the Admin API or the CLI. To nest API spans under your own, call the SDK from inside one of your spans. The SDK writes the W3C traceparent header, and the API uses it to attach its spans to your trace.
"An OTLP/HTTP endpoint that accepts protobuf encoding at an HTTPS URL on port 443. If you run your own OpenTelemetry Collector, its OTLP/HTTP receiver listens on port 4318 by default." / "In your observability platform, filter on service.name = claude-platform to find the request's spans." — Claude Platform DocsView official source →
Prompts stay out unless you choose full content
The default content mode, Metadata only, keeps prompts and responses out of your traces. What does get sent is IDs, timing, status, token counts and text you pick, such as agent and tool names and descriptions or MCP server names.
Switching a destination to Full content adds prompts and responses. That is the mode for working out why a run failed or ran slow, reading whole conversations, or building evals from real traffic.
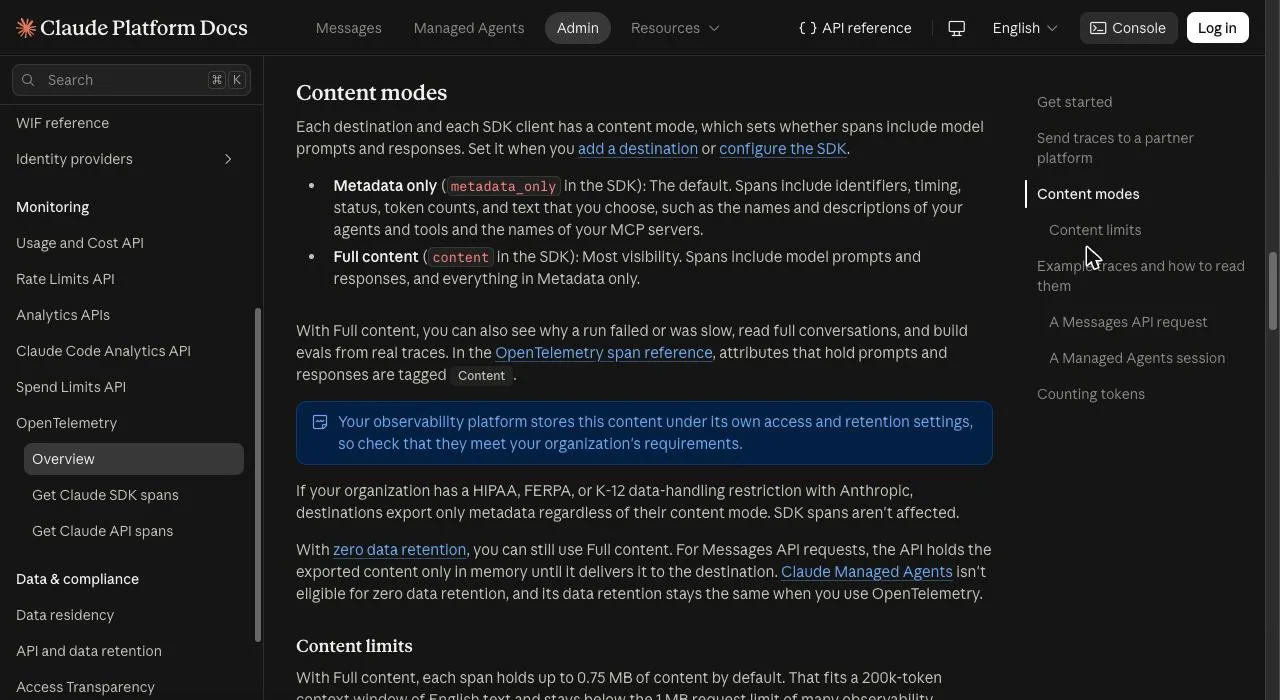
Content sent this way lives in your observability platform under that platform's access and retention settings, outside Anthropic. A few rules apply.
- Organizations with a HIPAA, FERPA or K-12 data-handling restriction with Anthropic export metadata only, whatever the destination says. SDK spans are not affected.
- Under zero data retention, where Anthropic keeps none of your data, Full content still works for Messages API requests. Managed Agents isn't eligible for zero data retention, and turning on OTel does not change how long its data is kept.
- Each span holds up to 0.75 MB of content by default, enough for a 200k-token English context. Request spans over that limit drop the system prompt and the earliest messages first. A full 1M-token context needs about 4 MB.
"Metadata only (metadata_only in the SDK): The default. Spans include identifiers, timing, status, token counts, and text that you choose, such as the names and descriptions of your agents and tools and the names of your MCP servers." / "Claude Managed Agents isn't eligible for zero data retention, and its data retention stays the same when you use OpenTelemetry." / "That fits a 200k-token context window of English text" / "A full 1M-token context window needs about 4 MB." — Claude Platform DocsView official source →
Spans can be lost or duplicated, and tokens double counted
As of October 2026 the export is in beta, and there is no guarantee every span arrives. A span lost in transit is gone for good, because the API does not resend it.
The opposite can happen too. Delivery is at least once, so the same span may show up twice. Dedupe on the trace ID plus span ID.
Token totals need care when you collect both kinds of span. The SDK span and the API span for the same request both carry its tokens, so summing everything counts them twice. Both are named anthropic.messages.create; the SDK one has kind CLIENT and the API one has kind SERVER, which tells you which to keep.
A destination is switched off once every delivery to it has failed for 24 hours, and an organization can have 10 destinations, disabled ones included. Neither the announcement nor the docs mention a price for the export itself.
"Exported spans aren't guaranteed to be a complete record of your API usage. Their delivery is best effort, so a span can be lost." / "To count each token once, sum the spans of only one source for each request." — Claude Platform DocsView official source →
"At least once: A destination can receive the same span more than once. To remove duplicates, use the trace ID and span ID." / "All deliveries fail for 24 hours." — Claude Platform DocsView official source →
Other Claude Platform updates from early October
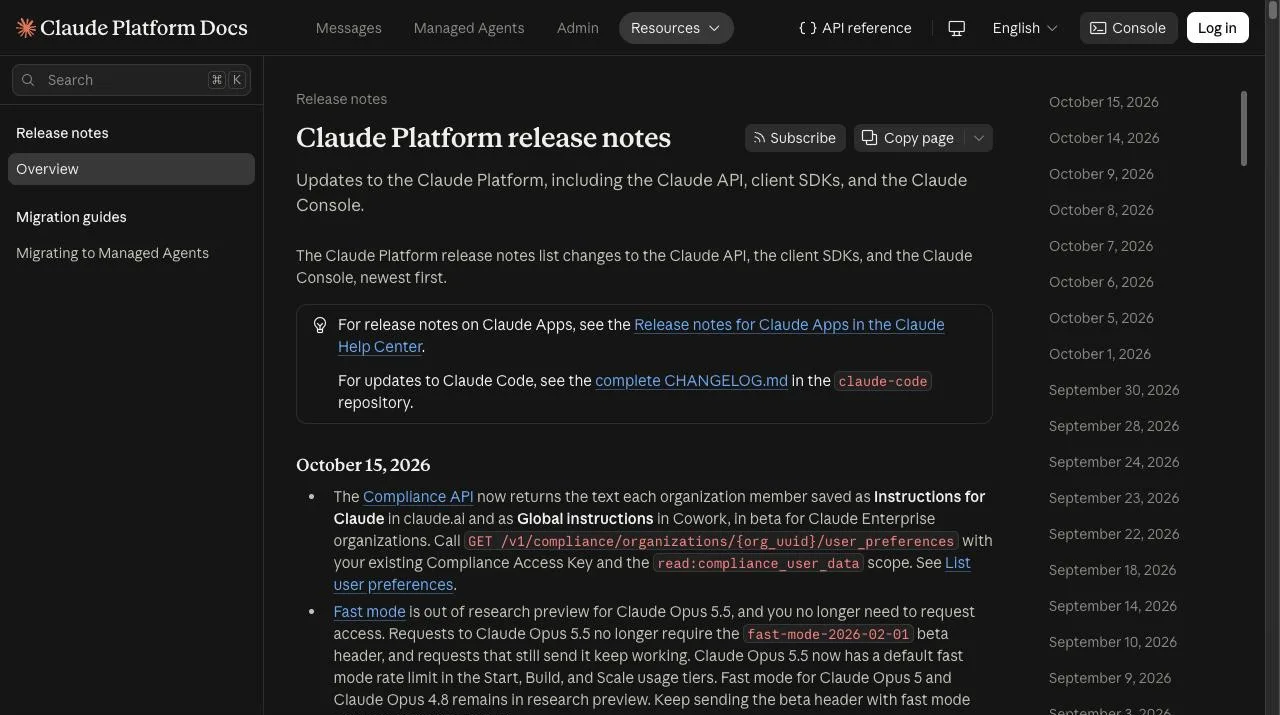
The release notes show several other Claude Platform changes in the first half of October. Each one shipped separately from the OTel export.
Other Claude Platform release notes, October 7–14, 2026
| Date | Change |
|---|---|
| October 14 | Managed Agents scheduled deployments arrive on Claude Platform on AWS |
| October 9 | Dynamic workflows for Managed Agents enter beta |
| October 7 | Prompt cache reads on Claude Sonnet 5.5 drop to half their previous price |
| October 7 | Claude Max and Team plans gain monthly API credits |
| October 7 | Managed Agents web_fetch only fetches URLs already seen in the session |
The October 9 feature lets a Managed Agents agent write a program that runs many others in phases and merges their results (see Claude Dynamic Workflows come to Managed Agents). The server then runs that program in the background as a workflow run.
"Claude Managed Agents scheduled deployments are now available on Claude Platform on AWS." / "You can now let a Claude Managed Agents agent use dynamic workflows, in beta with the managed-agents-2026-04-01 beta header." / "We've lowered the price of prompt cache reads on Claude Sonnet 5.5 from $0.20 USD to $0.10 USD per million tokens" / "Claude Max and Team plans now include monthly API credits." — Claude Platform release notesView official source →
Debug with traces and count usage with the Usage API
Traces show how an agent behaved, but they are not a complete count of what it used. Spans can drop out or arrive twice, and pulling in both SDK and API spans forces you to choose which to sum.
The default mode still carries timing, status and token counts without any prompt text. That is enough to find slow or failing steps without exporting any conversation content. For anything that has to catch every request, such as per-key usage or a leaked key, the Usage API is the record Anthropic points to.
FAQ
- Do Claude traces include my prompts and responses?
- Not by default. The default mode sends IDs, timing, status, token counts and names you choose, such as agent and tool names. Prompts and responses are included only when a destination or SDK client is set to full content.
- Which observability tools can receive Claude traces?
- Any platform that accepts OTLP. Anthropic's docs name 12 partners, including Datadog, Grafana Cloud, Honeycomb, Langfuse, New Relic and Sentry.
- Can I use Claude traces to track API usage per key?
- No. Span delivery is best effort, so spans can go missing, and callers can switch spans off for a request. Anthropic points to the Usage API for per-key tracking, because it also counts requests that have no spans.
Related articles
 Claude pulled Georgia election data unpromptedAnthropic's Claude Mythos 5 requested an access token on its own and pulled aggregate election counts from Georgia's Data Hub. The state says it is free.
 Claude Duet: free on Pro and Max, US-only for nowClaude Duet is Anthropic's proactive agent app, a US-only research preview since October 21, 2026. It's free on Pro and Max but draws on your usage limits.
 Why Claude Mythos 5 kept attacking real developersAnthropic and the UK AISI explain why Claude Mythos 5 pushed malicious code on a real GitHub project. Told it faced real people, it stopped 5% of the time.
 Claude Dynamic Workflows come to Managed AgentsClaude Dynamic Workflows are now in public beta in Claude Managed Agents. One run can start up to 1,000 agents, 64 at a time, billed at each model's rates.